For the eigth guest post by OKCon 2013 speakers we thank Javier de la Torre and Andrew Hill. Javier’s partner at cartoDB Sergio Alvarez will be running the workshop ‘Online Mapping: how to analyze, visualize and build apps with your geospatial data’, as part of the Technology, Tools and Business programme, on Monday 16 September, 17:15 – 18:15 @ Room 19, Floor 3.
Using CartoDB to tell stories in open data
In the open data, mapping, and GIS circles of New York City, the PLUTO dataset has been the topic of many conversations over the years. It gained a good amount of its reputation from being one of few datasets apparently exempt from Mayor Bloomberg’s open data initiatives. The reputation was probably helped by the fact that the data was actually available to researchers and businesses, for a price. That all changed back in late July when the Department of Planning revised its policy on the dataset, making it free to all users.
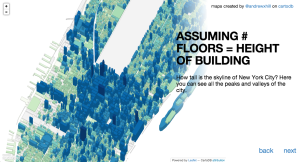
It was probably only a matter of hours after the update before our friends were tweeting and emailing us the reports. It isn’t everyday that an important new dataset that you have talked about hundreds of times before, suddenly becomes free to the public. A couple weeks passed before we were able to sit down and dig into what this data really contains. At the request of our friends over at OpenPlans, we started to put together a tour of the PLUTO data. What started as a small project to create a handful of maps, quickly grew into a tour with nearly 30 interesting stops.

We were not sure what other people would think of the tour, for us it was just exciting to take people along in our own journey to uncover what was inside the dataset. It turns out that quite a few other people also liked the tour. We think this is just a small testament to the impact that open data can have, both on journalism as well as data literacy, communication, and a host of other subjects. We can’t help but think that it must be an exciting time to be an anthropologist. We know that as data come available in easy-to-use formats, exciting new research and reporting projects will come with them.
This is where our own open source project, CartoDB, comes in. When we started the PLUTO Data Tour, we really had no idea what we expected to find or show from the data. With CartoDB though, we were able to quickly pull out of this huge dataset a few unique and interesting stories, through the use of SQL and CSS to filter and style our maps. That ability is priceless when building technology around data or even creating visual experiments like those we created for the tour.
At this year’s OKCon, we are very excited to be giving a small workshop to those interested in CartoDB, our open source mapping technology. We want to show others how to go from data to maps and visualizations quickly without having to sacrifice usability or beautiful design. If you are interested in those things, consider joining us for the workshop. It will be a great time and you’ll get to work hands on with us to start building the next generation of maps from open data on open source software.
Andrew Hill is the senior scientist at Vizzuality where he explores the future of online mapping to help guide innovation at CartoDB.

